Unlocking Relationships in Oil & Gas Data with Graph Databases
In the oil and gas sector, data is vast, complex, and highly interconnected. From exploration to production, every well, license, and facility carries relationships that often get buried inside traditional tabular systems.
Recently, I worked on building a graph database using the Factpages dataset (official public data from Norwegian Offshore Directorate). The goal was to model how different entities in oil and gas relate to each other and uncover insights that would otherwise remain hidden.
Why Graph Databases?
Traditional relational databases are great for structured records, but when it comes to exploring connections—for example, which operator managed a specific wellbore drilled from a facility in a given license area? – queries become complex and inefficient.
Graph databases like Neo4j are designed for this very challenge. They allow us to model, store, and query relationships directly, making it easier to
- Visualize hierarchies between Areas, Licenses, Fields, and Wells.
- Identify operational dependencies and potential bottlenecks.
- Enable faster decision-making by showing a connected picture of the ecosystem.
The Model I Built
Using Neo4j Community Edition, I created nodes and relationships representing key oil and gas concepts:
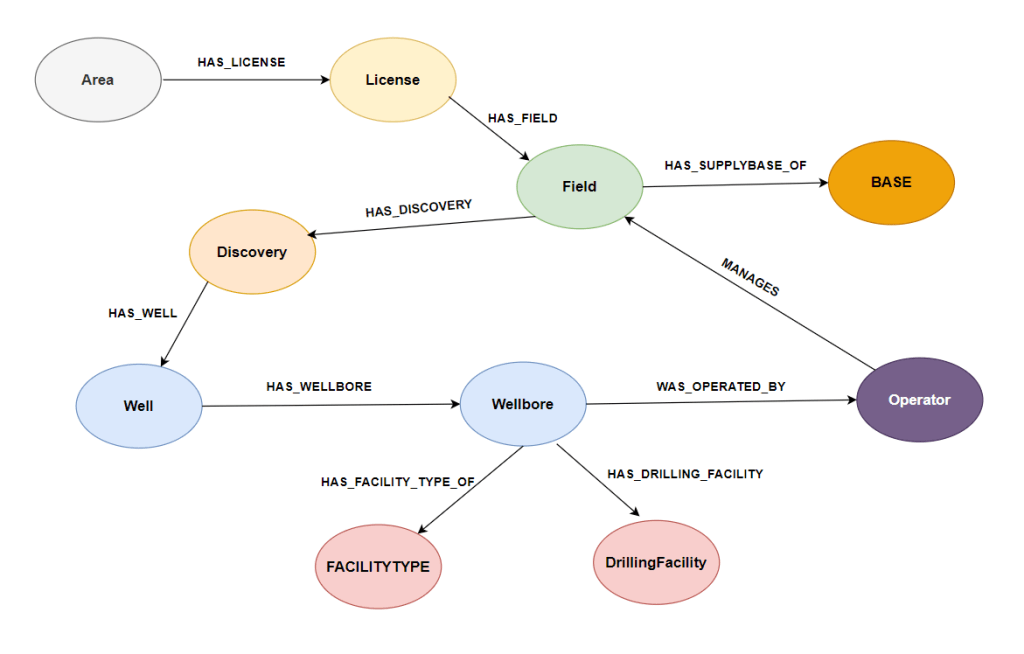
- Nodes: Area, License, Field, Discovery, Well, Wellbore, Drilling Facility, Facility Type, Operator, Base.
- Relationships: HAS_LICENSE, HAS_FIELD, HAS_DISCOVERY, HAS_WELLBORE, WAS_OPERATED_BY, MANAGES, HAS_SUPPLYBASE_OF and more.
This model mirrors the real-world hierarchy:
- An Area contains Licenses
- A License has Fields
- A Field may have Discoveries and is Managed by Operators
- Wells and Wellbores are tied to Facilities and Bases
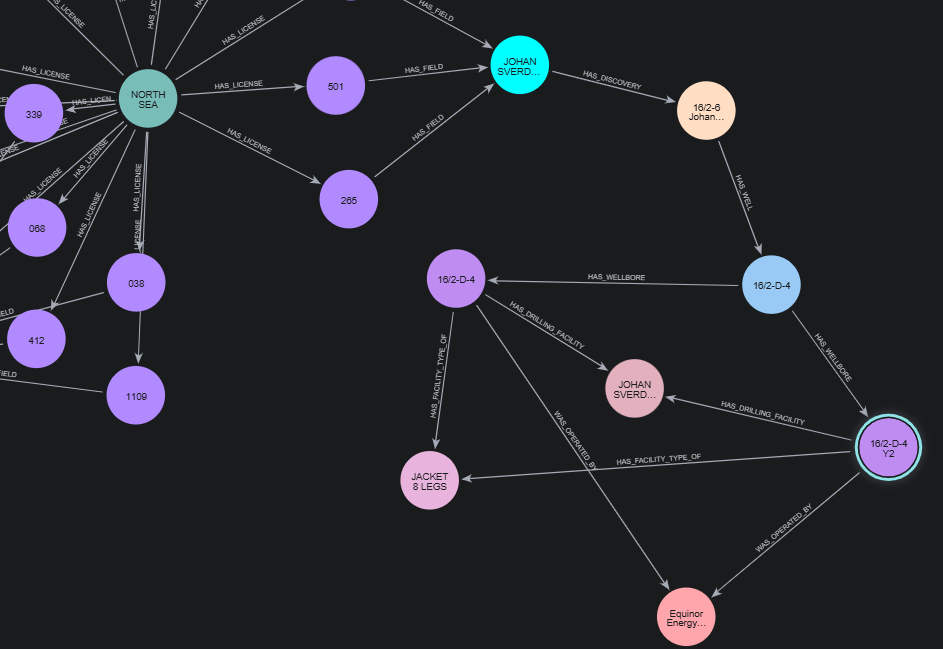
Instead of looking at isolated spreadsheets, the entire ecosystem becomes a living map of connections.
Why Neo4j?
I specifically chose Neo4j for this project because:
- I am certified in Neo4j, which gave me confidence in modeling and querying.
- Ease of use – Cypher query language is intuitive.
- Visualization tools – Neo4j Bloom makes it simple to present relationships interactively.
- Integration capabilities – From RAG (Retrieval Augmented Generation) to APIs, Neo4j fits modern AI-driven workflows.
- Community edition – Free to experiment with, yet powerful enough for real projects.
Other graph databases exist, but Neo4j’s maturity and ecosystem made it a natural fit.
Benefits for Oil & Gas Operators
By adopting graph databases, operators can:
- Gain a single connected view of licenses, fields, wells, and facilities.
- Quickly identify dependencies and optimize operational decisions.
- Support regulatory reporting with traceable relationships.
- Enable knowledge graphs that power AI applications in exploration and production.
Use Cases
1. Short supply-chain paths between Areas and Operators
Illustrates the power of graph pattern search (shortest path) to expose direct and indirect relationships between geographic Area and Operator — handy to explain how influence or responsibility flows in the graph.

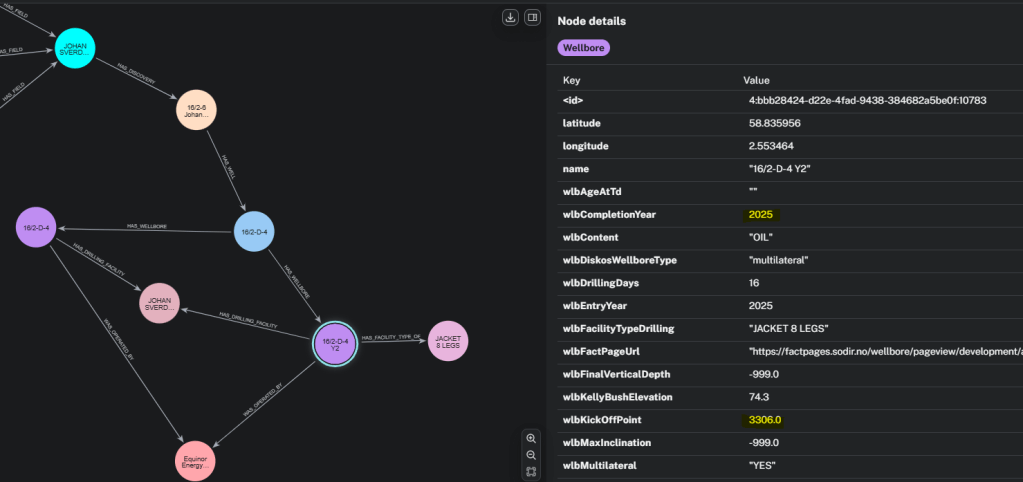
2. Recent producing wells with high kickoff depth (Area → … → Wellbore view)
Surface recent producing wellbores (2025) with unusually deep kickoff points(>2500) to prioritize inspection, production optimization, or subsea intervention planning.

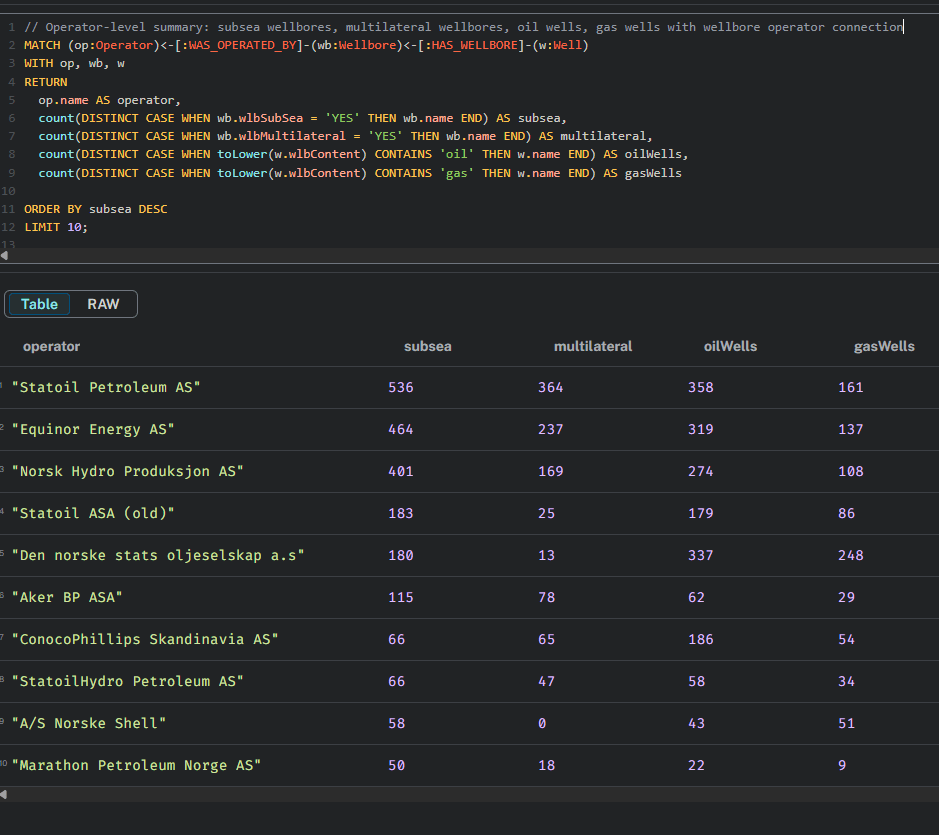
3. Operator Footprint
With this graph query, I can see each operator’s footprint: subsea & multilateral activity, and the balance between oil vs. gas wells (with connections).
Try It Yourself
This project is available on my GitHub.
🔗 Anyone with Docker can set it up on their machine—I’ve included a detailed README with step-by-step instructions.
Why I Did This Project
At its core, this project reflects my passion and career direction:
- I genuinely enjoy working with data—wrangling, modeling, and finding patterns.
- It helps me increase my domain knowledge in oil and gas.
- It becomes part of my resume portfolio, strengthening my profile for future opportunities in data engineering and energy domain projects.
